
Ads down, orders did not come up, where is the problem?
SEM ads are burning money every day, but orders are slow to come in - this may be the most frustrating scenario in digital marketing in 2026. You slam your budget into Google Ads, Baidu promotion, watch the CPC numbers jump, clicks are rising, but the background conversion data is like being pressed the pause button.
It's not your illusion. The data comes to you: 78% of digital campaign failures stem from technical errors, 63% of failures where the strategy is completely disconnected from the business goals. What's even more solid is that 81% of the traffic you're buying is website visits that simply won't convert into customers. The cost of clicking is rising, the conversion efficiency is falling, and this dead cycle has made countless businesses turn their marketing budgets into a consumption with no return.
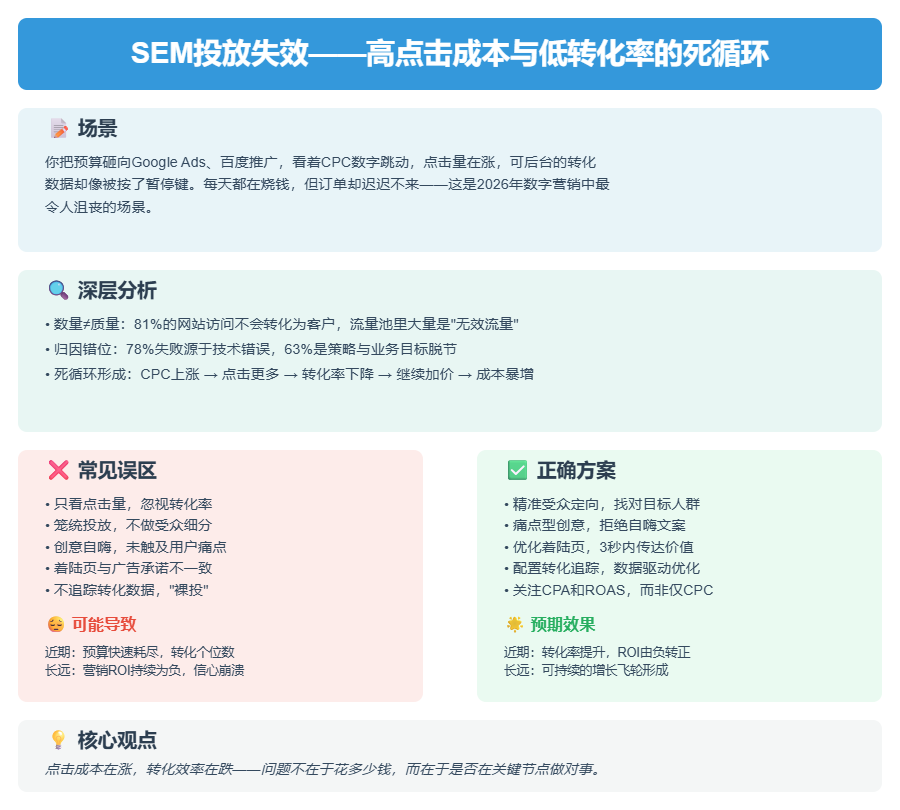
Where is the problem? Over the past three years, we've audited more than 200 SEM accounts, and the data reveals that the vast majority of failures can't be wrapped around five common root causes - it's not that the creative isn't good enough, it's not that the bids aren't high enough, it's that mistakes are consistently being made at key points:
Audience Misalignment. 41% The advertising budget flows to people who are completely mismatched with the ideal customer profile. You sell enterprise SaaS, but the ads are shown to freshly graduated interns; you push high-end customized furniture, but the clicks are young white-collar workers who rent and change houses frequently. The money is spent, but the people are not right.
Creative weakness. The title is full of “industry-leading“ and “quality assurance”, the picture is an outdated product posing, and the CTA button hides three screens away. This kind of ads can cheat to click, but can not cheat trust - users come in three seconds to close, the bounce rate directly through the floor.
The landing page is poor. This is the most overlooked fatality.53% Visitors leave when the page loads in more than 3 seconds, and your landing page may still be using a five-year-old template with hidden CTAs, lengthy forms, and no social proof. While ads bring people in the door, pages hand-deliver them away.
Technical faults. Conversion tracking code installed in the wrong place, match type selected as a broad match to attract junk traffic, bidding strategy and business goals screwed - these technical details are not resolved, you see the “data“ itself is distorted. Many accounts, the actual conversion is not recorded, optimization decisions based on false data.
Missing data. Only focus on CPC and CTR, but never calculate CPA (single customer acquisition cost) and ROAS (return on advertising); never do A/B testing, every decision depends on patting the head; data lying in the report, but decision-making stays at the level of intuition.
These five problems are interlocked. If the audience is wrong, the best ideas are useless; if the ideas are weak, the landing page can't pick up the traffic even if it's strong; if the technology doesn't work, all the optimization is just a blind man feeling an elephant; if the data doesn't work, the same mistakes will happen over and over again.
But the good news is that each problem has a clear diagnosis and adjustments that can be made immediately. You don't need to push back, you just need to do a few things right at key points - recalibrate the audience, refactor the landing page experience, fix the technical configuration, and create a data-driven workflow.
🔑 critical: The five causes of failure tend to co-exist and amplify each other - don't look at individual problems in isolation when diagnosing, quickly scan these five nodes first and find the most painful 1-2 cuts to fix first, to stop the bleeding more quickly than spreading it out across the board.
What will you take away when you finish reading this article? A checklist of five specific issues, the corresponding steps for each issue, and a methodology to verify whether the adjustment is effective. We don't talk about theory, we just talk about “what you can do before you leave work today“.
The first thing to address is who your ad is actually talking to.
If the audience is wrong, it's useless to advertise to anyone.
In the previous chapter, we talked about the nature of SEM advertising failure is a systematic collapse of traffic quality, not simply “not enough traffic”. The vicious circle of high CPC and low conversion rate, the root cause is often buried in the first step: advertising to whom.
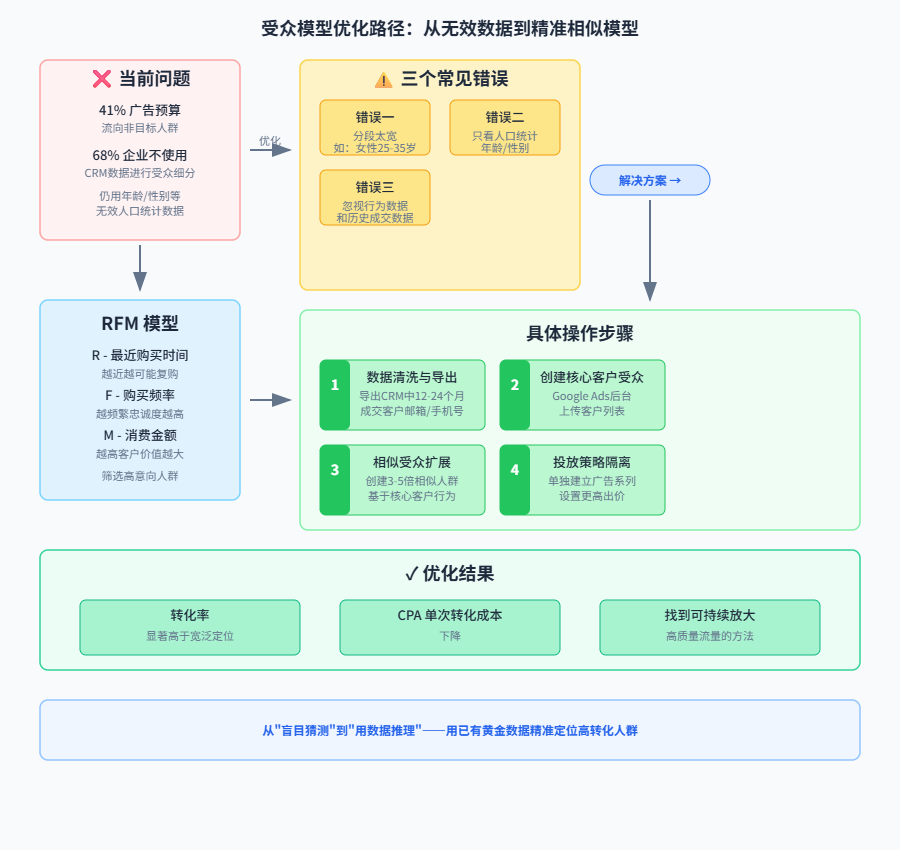
41%“s advertising budget goes to the ”untargeted".
This is not an estimate, it's the median of hundreds of SEM accounts audited over the last three years. Your ads are being clicked on by interns, by curious competitor employees, and by “traffic tourists” who will never close a sale. They consume your budget, drive up the average cost-per-click, and evaporate like water vapor on the landing page.
The heart of the problem is that audience segmentation for the vast majority of businesses is a gamble based on imagination. Data shows that in the Brazilian market, 68% companies don't use CRM data for audience segmentation at all, and still stick to the last century's demographic labels such as age and gender. It's like a fisherman who casts his net based on the impression that there might be fish in the sea, but never researches the habits, habitat depths, or bait preferences of different fish populations. The result: the majority of the net cast is filled with water plants and garbage.
This ineffective audience strategy usually makes consistent mistakes in three specific areas:
First, the division is too wide. “Female, 25-35 years old, living in a big city” - this is the real audience setup in countless SEM accounts. This range covers tens of millions of people, but how many of them actually have a need for your product (e.g. high-end customized wedding dresses)? Overly broad filters make the ad look like a dud, appearing to cover a wide range of people but having no penetration.
Second, look only at demographics. Age and gender are pretty much ineffective labels today. A 35-year-old male could be a product director at a tech company or a construction worker fresh off the job site. Their interests, willingness to buy, and income levels vary wildly. Your ad platform actually holds a far richer set of signals: search history (intent), browsing behavior (interests), device models (spending power), and frequented locations (lifestyle) ...... Looking only at demographics is tantamount to giving up on the most accurate navigator.
Third, behavioral and historical data are ignored. This is the deadliest waste of all. Which people on your website shopped the product detail page and left? Which customers in your CRM have completed a purchase? This is a gold mine of data more valuable than any external profile. But in reality, only 18% Brazilian companies use historical purchase data for remarketing or similar extensions. This means that most of the money is spent on finding “newcomers”, while leaving out the “regulars” and “high intent visitors” with the highest conversion potential.
The solution is not to guess with more imagination, but to reason with the golden data already available.
An effective method that has been proven countless times is the RFM model. It doesn't rely on any external labels, but instead scores customers based on the most authentic data of their interactions with your platform:
- R (Recency Last Purchased): How close is the most recent purchase? The closer it is, the higher the likelihood of another purchase is usually.
- F (Frequency Buy Frequency): How many purchases have been made over a period of time? The more frequent the purchase, the higher the loyalty.
- M (Monetary consumption amount): How much was spent in total? The higher the spend, the greater the value of the customer.
Based on RFM scores, you can clearly categorize your customers from “high value active customers” to “customers on the verge of churn”. Your core advertising budget should obviously be prioritized to maintain high-value customers (e.g., new product launches, exclusive memberships), while “dying customers” may be targeted with recovery strategies (e.g., sending coupon ads). This model transforms “audience” from a vague concept into a quantifiable and actionable asset grouping.
Know the principle, then how to land on the SEM platform? You need a “surgical program” that can be implemented immediately:
Step 1: Data cleaning and export.
Log into your CRM or e-commerce backend and export the email list (or cell phone number list) of all customers who have closed a deal in the past 12-24 months. Make sure the data is accurate, which is the basis for all subsequent operations.
Step 2: Create a core customer audience.
Go to your Google Ads backend (or the corresponding Meta Ads Manager) and find “Audience Manager” in “Tools & Settings”. Here, you can upload the list of customers exported in the first step and name it “Core Clients” or some other recognizable name. The platform hashes and encrypts this data to protect privacy.
The subtext of this step is: tell the ad platform, “I'm looking for users who are similar to these people.”
Step 3: Launch the “Similar Audiences” extension.
This is the key to amplifying a high-quality traffic pool. After uploading your core customer list, platforms usually offer the option to “create similar audiences”. Choose a reasonable scale - it's usually recommended to start testing at 3-5x. This means that the platform will look for people 3-5 times the size of your core customers across the web who have the most similar behavioral patterns and interests, and show them your ads.
Step 4: Placement strategy isolation.
Create a separate campaign, or at least a separate ad group, for this newly created “similar audience”. Set a more competitive bid for them (since they are more likely to convert) and design ad creative that is more appropriate to their stage (e.g., emphasize word-of-mouth, social proof, professional solutions rather than basic functionality). By segregating the placements, you can clearly track the ROAS of this “high intent traffic” and verify their effectiveness.
Verify that this strategy works by looking at just two metrics:
- Conversion rate: Do ad groups targeting “similar audiences” convert at a significantly higher rate than your previous broadly-targeted ad groups under the same landing page conditions?
- CPA (cost per conversion): Has your single customer acquisition cost gone down?
If the answer is yes, then congratulations, you've not only found the right people, but you've also found a way to consistently amplify high quality traffic. Instead of passively paying for each click, you're actively using your budget to “buy” people with a high probability of conversion.
Once your radar is finally set on the right target, the next test comes: can the creative catch this “high intent” and turn it into a click? A bad graphic, or a mediocre headline, is enough to undo all of your accurate targeting.
Creative eye-catching but can't keep people, the problem is after the click
Audience targeting is accurate, and the creative hooks the eye - but what happens after the user clicks?
This is the “second ghost gate” for most SEM accounts. Traffic comes in, but is lost the moment the page loads. You think you're spending your budget on “leads”, but in reality you're just paying for a closing window that pops up at the drop of a hat.
A high CTR doesn't mean good quality traffic, it could be a cover party.
Click-through rates are a deceptive metric. A scary cover image or a sensational headline is enough to make countless people click on it on impulse. But the traffic that is “tricked” into clicking through has one common characteristic: there is a huge gap between what they expect and what the page actually delivers. Users with a kind of expectation to click in, but found that the page said is another thing - they will immediately leave, without any hesitation.
This is manifested in the data: your CTR is higher than the industry average, but the bounce rate is also incredibly high, the real key conversion rate is lower. High click, low conversion, is the most typical symptoms of the “cover party”.
The problem is not that the ad creative was too successful, but that the landing page didn't live up to that expectation.
Even trickier, 53% of visitors simply leave when the page loads in more than 3 seconds. This isn't alarmist talk - it's internal Google data and the root cause of Core Web Vitals becoming a ranking factor. Your landing page may load just fine on a computer, but poor performance on mobile is driving away your potential customers with every second.
A selling sports shoes e-commerce once measured: the mobile first screen loading time from 4.2 seconds optimized to 1.8 seconds, the conversion rate directly increased 34%. This is only optimized a technical indicator, did not change any copy, did not change any picture. Speed itself is the hardest element of conversion.
But speed is only the first threshold. What really determines whether a user completes a conversion are three fatal design flaws in the landing page itself:
CTA hidden or blurred. Button colors that blend in with the ambient colors, locations that are tucked away at the very bottom of the page, or wording that is so abstract that it reads like a philosophical aphorism (“Learn more,” “Explore further”)-these are the things that Design that confuses users. The user looks at the page and thinks “okay,” but can't find any clear path to action and leaves.
The form is too long. Before confirming the value of the request to fill in the ID number, company name, annual budget ...... This is the vast majority of the landing page of suicidal behavior. Each additional required field, the average conversion rate fell 4% to 8%. users have not seen what you can solve the problem for him, it has been the first “information blackmail” persuaded to leave.
Lack of social proof. Human decision making inherently requires evidence. It's useless to say the product is good, you need others to say it's good. Customer reviews, sales data, media reports, certification qualifications - these are to dispel the user's concerns “the final kick”. Without these, the information conveyed on the page is “self-talk” and has zero credibility.
I'll give you a framework of proven solutions to these three problems:
A good landing page must fulfill all three elements at the same time, which I call the **“one-click conversion tripod ”**:
First kick: clear commitment. The first screen must clearly answer the question, “What problem does this page solve for me?” within 3 seconds of where the user's eyes land. Don't use a slogan, use a specific product or service description. For example, “helping e-commerce store owners double their conversion rate in 30 days” is 100 times more powerful than “leading e-commerce solution”.
Second foot: one-click action portal. The CTA button must meet three criteria: a strong color contrast with the page, a visible position on the first screen (visible without scrolling), and wording that uses an action verb with a clear result. “Get a quote now” is more effective than “submit”. Leave enough space around the button to create a visual focal point.
Third foot: customer testimonials or data endorsements. Above or below the CTA, put a real customer testimonial or key data. Even a sentence like “1,200+ companies have used our service” can significantly lower the decision threshold for users. Real details - client company names, specific numbers, clear scenarios - are more persuasive than a generalized “great service”.
The effectiveness of this framework has been verified by a large number of cases. An e-commerce company that sells office furniture redesigned its landing page by doing one thing: moving the orange “Ask Now” button, which had been tucked away at the bottom of the page, to the right-hand side of the first screen, and adding a customer testimonial above the button that reads, “After using their program, our office purchases were more efficient by 40%”. 40%". Nothing else changed. Three months later, their conversion rate had increased by 2,10%.
A small adjustment in the position of a button brings not a small optimization, but a multiplier. That's the value of a landing page - not simply “loading in” traffic, but turning every click into a real business opportunity.
Once your landing page is steadily catching high-quality traffic, the next critical component that determines success or failure surfaces: is the technology configured in such a way that every ad dollar is actually spent?
One wrong technical configuration, and all the advertising money goes down the drain.
When your landing page has been able to pick up a steady stream of traffic, the next step must be to interrogate a more insidious question: is your ad system itself, honestly recording conversion data?
I have seen too many accounts, on the surface of the ROI data is bright, in fact, conversion tracking code is not installed correctly - the system records the “conversion“ and the real completion of the user's purchasing behavior, the difference between eighteen thousand miles. This is equivalent to driving with eyes closed, the dashboard shows 60 mph, the actual has sped up to 120.
Conversion tracking not set up correctly is the biggest technical pitfall of SEM accounts.
A typical case: a B2B company reported a steady increase in “Form Submission Conversions“ for three consecutive months, but the sales team complained that the quality of the leads was deteriorating. After troubleshooting, it was discovered that the tracking code was incorrectly triggered on page loads rather than on successful form submission pages. As a result, a large number of users just opened the page, or even closed it in the middle of the process, and were counted as “conversions“. The system's CPA (Cost Per Acquisition) was 47% lower than the true value, a falsely optimistic figure that led the organization to believe it was on the right track.
What's more alarming is that an improperly set conversion window can directly distort your judgment of the campaign's effectiveness. If you set the window to 7 days, while the actual decision-making cycle of users is 30 days, the system will attribute to the wrong keywords or ad groups; on the other hand, if the window is set too long, it will incorrectly count the conversions brought by the natural traffic on the head of paid ads.
If conversion tracking is “wrong accounting“, then the choice of keyword match type is “wrong spending“.
Broad match leads to cheap clicks, precise match leads to real conversions - but most people choose the opposite.
Google Ads“ Broad Match has been revamped by AI after 2024, and it does expand to more “relevant“ search terms, at the cost of paying for a lot of marginal traffic. For an account that sells “commercial coffee makers,“ Broad Match could make your ads appear in “home coffee maker reviews,“ ”coffee maker repair tutorials,“ or even “coffee bean origins. "The CPC may look cheaper at 30%, but these clicks may only convert at 1/5 the rate of exact match.
Exact Match does have a higher CPC, but it locks out the group of people who “already know what they want“. The difference in purchase intent between users searching for “commercial automatic coffee machine 200+ people Rental“ and users searching for “coffee machine“ is more than one order of magnitude.
Realistically, I would recommend that you use a layering strategy:
Brand terms with exact match + manual CPC--This traffic is supposed to come to you, and controlling costs comes first.
Phrase Match + Intelligent Bidding for Category Words--Balance between relevance and coverage.
It is prudent to enable broad matching only if you have a clear need for topology and the ROAS is stable above 3--and must be paired with a list of negative keywords and a weekly cleanup of the search term report.
Even more overlooked than match types is the misalignment of bidding strategies with business goals.
Manual CPC for brand terms, smart bids for targeted conversions - this principle is violated with alarming frequency.
I have seen the account to the brand word opened “as much as possible to strive for more conversion“ intelligent bidding, the result is the system in order to “more conversion“, crazy low bid to grab low-quality traffic, brand word CPC is down, but the overall value of the conversion plummeted. There is also an account for the new cold start campaign open “target ROAS“, the system due to lack of data into the learning period of confusion, two weeks within the budget to burn empty but can not find a stable bidding rhythm.
The right choice of bidding strategy should be decided like this:
Manual CPC-For branded word defense, competitor word sniping, or any scenario where you need to finely control the cost per click. Provided you have the energy to adjust your bids weekly.
Maximize Conversions-For cold starts, let the system explore data quickly, but set a daily budget cap to avoid getting out of control.
Target cost per conversion (tCPA)-For accounts that have accumulated sufficient conversion data (at least 30 conversions in the past 30 days) and have a relatively even conversion value.
Targeted Return on Advertising Spend (tROAS)-For scenarios such as e-commerce where there is a large difference in conversion value, but it is important to ensure that the conversion tracking accurately records the amount of the order, otherwise the system will optimize on the wrong data.
The disorganization of the account structure is the root cause that makes all the above technical settings ineffective.
Stuffing 50 keywords per campaign is tantamount to giving up the possibility of optimization.
The optimization unit of Google Ads is Ad Group, not Campaign. When you put “commercial coffee machine rental“, “office water dispenser”, “staff pantry solutions” keywords in the same ad group, the system can not determine which display Creative, the quality score is pulled down, CPC is forced to rise, and ultimately lead to the overall deterioration of traffic quality.
A healthy account structure should follow the principle of “one theme, one ad group“:
- Each ad group contains 5-15 closely related keywords
- Ad copy must contain the group's core keywords
- Landing page URLs must accurately correspond to the ad promise
A machinery equipment manufacturer once reconstructed the account from “3 series according to product line“ to “27 ad groups according to purchase intent“, three months later, the average quality score increased from 5.2 to 7.8, CPC decreased by 34%, and conversion rate increased by 89%. After the structure is clear, the system can finally “understand“ what you are selling and display the ads to the right people.
Now, here's one for you that can be implemented immediatelyTechnical self-checklist:
Step 1: Validate conversion tracking
Open the “Conversions“ page of Google Ads, click on any conversion action, and check the “conversion time“ statistics. If a large number of conversions are recorded in a few seconds after the click, it is very likely that the code triggered a logical error. Compare Google Analytics 4 conversion events in the same time period, the number of deviations over 10% need to be troubleshooting.
Install Google Tag Manager (GTM) and migrate all tracking code from page hardcoding to the GTM container. This not only avoids code conflicts, but also allows you to tweak the tracking rules at any time without changing the site.
Step 2: Review match types
Download the search term report for the past 30 days and filter out keywords that are in the top 20% of spend but have 0 conversions. If these words are from broad match, add them to the negative keyword list immediately. If exact match keywords are not showing for a long time, check if bids are too low or quality score is being dragged down.
Step 3: Calibrate the bidding strategy
Open the “Suggestions“ page, ignore all the “Increase Budget“ prompts and focus on the system suggestions related to “Bidding Strategy“. If you are using Smart Bidding, make sure that the conversion data accumulation reaches the minimum threshold of the strategy (usually 30-50 conversions in the last 30 days).
Step 4: Reorganize the account structure
Export all keywords and group them manually by topic. Ask yourself: if a user searches for this term, what content is he most expecting to see? If two keywords in the same ad group have different answers, they should be separated.
Step 5: Set up conversion window analysis
Create an exploration report in GA4 to compare the conversion paths under the 7-day, 14-day, and 30-day attribution windows. If the 30-day window shows more than 40% of assisted conversions, your decision cycle is underestimated and you need to adjust the conversion window settings in Google Ads accordingly.
- Check where the conversion tracking code is triggered to make sure that the “Form Submission Success Page“ and not the “Page Load“ event is logged.
- Compare Google Ads and GA4 conversion data to confirm if they deviate by more than 10%
- Install Google Tag Manager to migrate tracking code from page hardcoding to GTM containers
- Download the last 30 days search term report, filter the top spending 20% but zero converting keywords and add to the negative list
- Check if manual CPC bids are used for branded terms and if smart bids are used for target conversion campaigns
- Verify that smart bid campaigns have met the minimum threshold of 30-50 conversions in the last 30 days.
- Review the account structure to make sure the number of keywords per ad group is in the range of 5-15 and that the topics are closely related.
- Verify that the ad copy contains the core keywords of the corresponding ad group, and that the landing page URL accurately matches the ad promise.
- Create exploration reports in GA4 comparing differences in conversion paths under 7-day/14-day/30-day attribution windows
- Check whether the conversion window setting matches the user's actual decision cycle and whether the percentage of assisted conversions exceeds 40%
After the technical level of demining is complete, you'll find an embarrassing fact: all the data is flush and the system is running fine, but most people still aren't using it - the data is lying in reports and decisions are still made by intuition. That's what the next level has to address.
The data is lying there and you're not using it.
The technical troubleshooting is complete and the system is working properly, but most accounts are still not earning -The data is obviously lying in the report, but the decision is still relying on intuition to pat the head.
It's not a technical glitch, it's an organizational flaw. I've seen too many teams with Google Ads running in the background, GA4 data streaming, Looker Studio dashboards lit up, and the weekly meeting is still “I think this idea feels good“ and “I think that word has potential”.The data-driven threshold is not a tool, it's the habit of translating data into action.
Putting data to work requires first solving three specific problems: what metrics to look at, how to target opportunities, and how to solidify them into a process.
Look at the right metrics first, then the right dimensions
CPC low does not mean that the ads are making money. A home furnishing brand CPC pressure to 1.2 yuan, CTR 4.5%, the surface is bright; but click on the background, the conversion rate of 0.15%, the customer unit price of 180 yuan, calculated CPA as high as 800 yuan - each transaction a single loss of 600 yuan. The root cause of the problem is that the team KPI only assessment “clicks“, optimizer naturally spend all the energy on catching cheap traffic.
There are only three tiers of metrics that really determine profit and loss:
- ROAS (Return on Advertising Spend)--Spend $1 and get a few bucks back, stop investing below the break-even point.
- CPA (cost per customer acquisition)-How much does it cost to acquire a closed customer and compare the lifetime value to determine if it's sustainable
- Conversion rate/customer unit price-Disassembling the driving factors of CPA to locate whether it is a traffic quality issue or an underwriting issue
But looking at account-level averages alone can hide the truth. For the same campaign, ROAS 4.2 for mobile and 0.8 for desktop; CPA $120 for new customers and $40 for reactivation - mix them together and you'll come to the erroneous conclusion that “overall it's okay“ and then Keep applying equal force in both directions.
Prioritization of disassembly dimensions: device type > new and existing customers > traffic source > keyword match type. Start by finding the subset of ROAS or CPA deviations from the mean that exceed 301 TP6T, where the optimization space of 801 TP6T is hidden.
| Decision value | risk of misinformation | Applicable Scenarios | Optimization direction |
|---|---|---|---|
| Measuring the cost and efficiency of attracting attention can be used as an indirect reference for initial traffic quality | Great, CPC/CTR good looks can mask poor trading results, leading to continued budget spend on losing traffic | Ad creative quality testing, initial discovery phase to get quick feedback on display and click data | Reduce cost-per-click and increase ad appeal (e.g., adjust copy, images) |
| Directly measures the actual commercial return on advertising spending and is the only basis for making profit and loss decisions. | Low, but requires tracking data to be accurate (e.g., conversion value, order amount) or the ROAS/CPA numbers themselves are not credible | Standing placement evaluation, budget allocation decisions, adjustment of target customer acquisition strategies | Increase order conversion rate, customer unit price, or reduce the cost of acquiring a single transactional customer |
From data anomalies to optimization assumptions
With the right disassembly, the next step is to create a closed loop of “hypothesis-verification“. Data won't tell you what to do directly, but it will help you eliminate guesswork.
Finding anomalies → formulating hypotheses → designing tests → verifying resultsThis process turns statements into action lists.
A practical case: a SaaS account shows that “form submission“ conversion is stable, but the sales team feedback lead quality continues to decline. Data dismantling found that from the “comparison and evaluation“ landing page in the user, the form completion rate is higher than the average 20%, but the signing rate is only other sources of 1/3. **Hypothesis: **Page design excessively guide the user to submit, filtering out the real high-intent customers. Test Solution: Keep version A as it is, add the mandatory option of “Please confirm the size of your business before downloading the program“ in version B to reduce the completion rate of the form but improve the quality of the leads. After two weeks, the signing rate of B version increased by 3 times, and ROI turned from loss to positive.
The key to being data-driven is translating “feelings“ into falsifiable hypotheses. “This idea is better” has to be turned into “Ideas with customer testimonials have a 15% lower CPA than ideas with purely functional descriptions“; “This audience is more valuable” has to be turned into “The ROAS of similar audience of repurchasing users within 90 days is 2x higher than cold launch audience“.
Google Ads “experiment“ function is the infrastructure for the implementation of the test: select the ad series → create an experiment → set the proportion of traffic distribution → set the success indicators (must be CPA or ROAS, can not be CTR) → run 2-4 weeks → with statistical significance to determine the winners and losers. Changes without experimental controls are tantamount to throwing the budget into a black box.
Making data work as muscle memory
Fragmented analysis is better than a solidified process.The weekly Friday afternoon data review meeting is a watershed moment for data-driven teams versus intuitive teams.
Standard Process:
- First 15 minutes, automated dashboard pushes anomaly alerts-- ROAS fluctuates over 20%, CPA skyrockets in a single day, zero conversions for 3 days in a row for a particular ad group
- 30 minutes in between to locate the root cause--What dimension is dragging down the whole? Device, geography, time period, creative version, audience segmentation?
- 15 minutes after the output of next week's test list--hypotheses, test scenarios, expected metrics, responsible person, deadline
On the combination of tools, GA4 looks at the behavioral path (where users come from, where they churn, and how many times they clicked before conversion), Looker Studio puts the multi-platform data into a decision view, and Hotjar uses heatmaps and video recordings to verify “how users actually clicked“. Hotjar uses heatmaps and video recordings to verify “how users really click“ - the data tells you “Bounce rate 60%“, the video recording tells you "Buttons are half blocked by the navigation bar on the phone".
- Check for anomalous alerts pushed by automated dashboards to identify ROAS fluctuations above 20%, CPA spikes in a single day, or zero conversions for 3 consecutive days in an ad group
- Split ROAS and CPA by device type, compare mobile vs. desktop performance, and identify subsets that deviate from the mean by more than 30%
- Split data by new and old customer dimensions, compare new customer CPA with old customer reactivation CPA, identify high cost customer acquisition groups
- Split conversion paths by traffic source dimensions to locate low-quality traffic entrances
- Locate the root cause: identify whether it's the device, geography, time of day, creative version or audience segmentation that's dragging down overall performance
- Verify that optimization recommendations are accompanied by data sources to avoid intuition-based decisions
- Review to-be-live tests for defined success metrics (must be CPA or ROAS, not just CTR)
- Check Google Ads experiment settings: traffic allocation ratio, run period (2-4 weeks), conditions for determining statistical significance
- Output a list of tests for the next week with assumptions, test scenarios, expected metrics, responsible person and deadline
- Weekly meeting conclusions translated into specific action items and entered into the task tracking system
But as many tools as there are, without the discipline of “data in and data out“, they are all for naught. It's mandatory: any optimization suggestion must be accompanied by data sources, any go-live test must define the success criteria in advance, and any conclusion from the weekly meeting must be transformed into next week's action items. This discipline is more important than buying Looker Studio Enterprise Edition.
🔑 criticalThe three most dangerous words at a review meeting are “look again“ - not making a decision when ROAS fluctuates 20% and waiting for next week is tantamount to validating last week's mistakes with this week's losses. Set hard rules: any subset of 30% deviations from the mean must be produced on the spot to test the hypothesis, otherwise you are still discussing the same set of numbers at the same time next week.
From this chapter to the next, I'll take this data methodology and the technical, creative, and audience strategies from the previous four chapters and integrate them into a weekly optimization checklist that can be implemented directly. You don't need more theory, what you need is to turn the data from “visible“ to “useful“ path to the ground.
Do these 5 things right now.
The previous five chapters have dug through the root causes of SEM burnout: audience misalignment, underwriting failures, technological landmines, and data slumber. Knowing where the problem is is not the same as solving the problem -Optimizing your SEM account starts the next second you read this article.
No need to overturn and start over, do these five things first.
Step 1: Pouring out the real money in the CRM
Your list of closed customers is worth more than any third-party label. Open your CRM and export all of your closed customers for the past 6-12 months - cell phone numbers, email addresses, as many as you can. Upload this list in the Google Ads backend, create a “similar audience“ and the system will automatically find the “digital twin“ of this group of people.
Don't be greedy, control the expansion times at 3-5 times. If the expansion is too wide, the similarity will be changed; if the expansion is too narrow, the volume will not be able to run. If the past three months turnover customers less than 300 people, first expand 3 times; more than 1,000 people, try 5 times. After running for a week, look at the CPA, which is lower than the cold start audience 20% or more, even if it is successful.
💡 tipThe uploaded CRM data column names (e.g. email, phone) should be consistent with the platform templates. If there are fields such as name, purchased products (SKU), consumption amount, etc., please make sure to export them together, so that the system can establish a higher value and more accurate “similar audience stratification”, not just “yes/no” purchase.
Step 2: Give landing pages a medical checkup with PageSpeed Insights
53% visitors will simply close the page when it loads for more than 3 seconds. Open PageSpeed Insights, enter your core landing page URL, and focus on two numbers: the LCP (maximum content drawing) and the CLS (cumulative layout offset). Anything more than 2.5 seconds for the former and 0.1 for the latter, and a good chunk of your ad dollars are being burned at the Loading screen.
Mobile scores are especially important - over 60% of traffic in Brazil comes from cell phones. If the score is below 70, prioritize compressing the first screen image, cutting out non-essential tracking code, and getting the tech team to enable a CDN - this isn't “experience optimization“, it's a direct stop-gap action.
🔗 Related resources: PageSpeed Insights
Google's official web performance testing tool, enter a URL to generate mobile and desktop scores
Step 3: Verify that conversion tracking is actually working
Go to GA4“s “real-time“ reports, click on an ad, complete a purchase or form submission yourself, and see if the event is captured. Many accounts have phantom “conversion" data - the code is on the wrong page, the event names don't match, or it's tracking clicks but not transactions.
Check three things: is the conversion code triggered on the thank you page/order completion page? Is the event name the same as the one set in Google Ads? Does the conversion value bring the actual amount? If any one of them doesn't match, the ROAS in the report is fake.
- Open GA4 real-time reports and prepare to capture test events
- Complete a purchase or form submission by actually clicking on an ad to go to the website
- Confirmation that the conversion code is correctly triggered on the thank you page/order completion page
- Check if conversion events are captured in GA4 real-time reports
- Verify that the event name in GA4 matches the conversion name set in the Google Ads backend
- Verify that the conversion value (conversion amount) is brought up to the actual order amount
- Compare whether there are significant differences between ROAS data in the statement and actual transaction data
- Check for ghost data (code loaded on wrong page or event name mismatch)
Step 4: Discontinue ad groups with ROAS below 2
Open Google Ads, filter by “Ad Groups“ dimension, and select the last 30 days. Suspend all ads with ROAS below 2 - not drop the price, but suspend. These groups are not contributing to conversions, they are eating the profits of other groups.
If you hesitate to “stop will not have the volume“, do some math: ROAS 1.5 means that every 100 yuan spent only 150 yuan back, after deducting the cost of products, logistics, labor, the actual loss of money. Low ROAS “volume“ is poison, not business.
Step 5: Establish a keyword “end-of-life“ system“
Fixed 30 minutes a week, open the search term report, filter “the past 14 days, the number of conversions = 0“ keywords. Two consecutive weeks without conversion of the word, directly negate or delete. Do not be soft, SEM account bloat is so stacked up - three years ago on the line of the word, now no one searched, but also secretly deducted.
Also look at the “search terms“ rather than “keywords“ report. What users actually type in is often a million miles away from what you buy. Adding irrelevant search terms to the negative keyword list is a zero-cost way to improve tráfego qualificado.
None of these five things require you to write code, change platforms, or wait for a monthly review. The first two can be done by the end of the day today; all five will fall into place during the week.SEM is not metaphysics, it's engineering - engineering problems solved with lists, not inspiration.